The S&P 500 proved to have a track record of setting records, this time by a 0.8% increase, made possible by the willingness to boost the stock prices and major indexes of the Federal Reserve. The Nasdaq surged 1.5%, while the Dow Jones Industrial Index barely moved from its Wednesday rally, staying nearly equal to its previous value.
The Fed stabilised the economy by trimming rates by 25 basis points, a move market participants expected following September’s larger 50 basis point cut. Chair Jerome Powell emphasised that the Fed relies on data to guide its decisions and may adjust policy up or down based on economic results.
Strong Growth Amid Fed’s Active Rate Cuts
Although the Fed is using a little different language on inflation, replacing “further progress” with “progress” alone still, analysts were imperceptible.
Goldman Sachs considered the wording change as a ratification of the fact that the rate-slashing process is underway rather than as a signal of a lack of confidence. Inflation is still a bit above the Fed’s 2% target, albeit it did some small cooling in September.
Analysts forecast that the S&P 500 will perform better in the future and that fiscal policies will serve as a catalyst for the creation of a better business climate. Evercore ISI’s forecast says that the index may peak by me-de next year based on the fact of rumours and investors’ optimism around the business-friendly environment, including low taxes and lessening of regulations in the current administration.
Powell further commented on the recent election, which he said would not affect Fed policy in the short term. The monetary authority focuses on economic factors rather than political matters. Overall, the S&P 500 leans toward a possible rise as market sentiment improves with policy easing and positive business forecasts.
S&P 500 Index Chart Technical Analysis

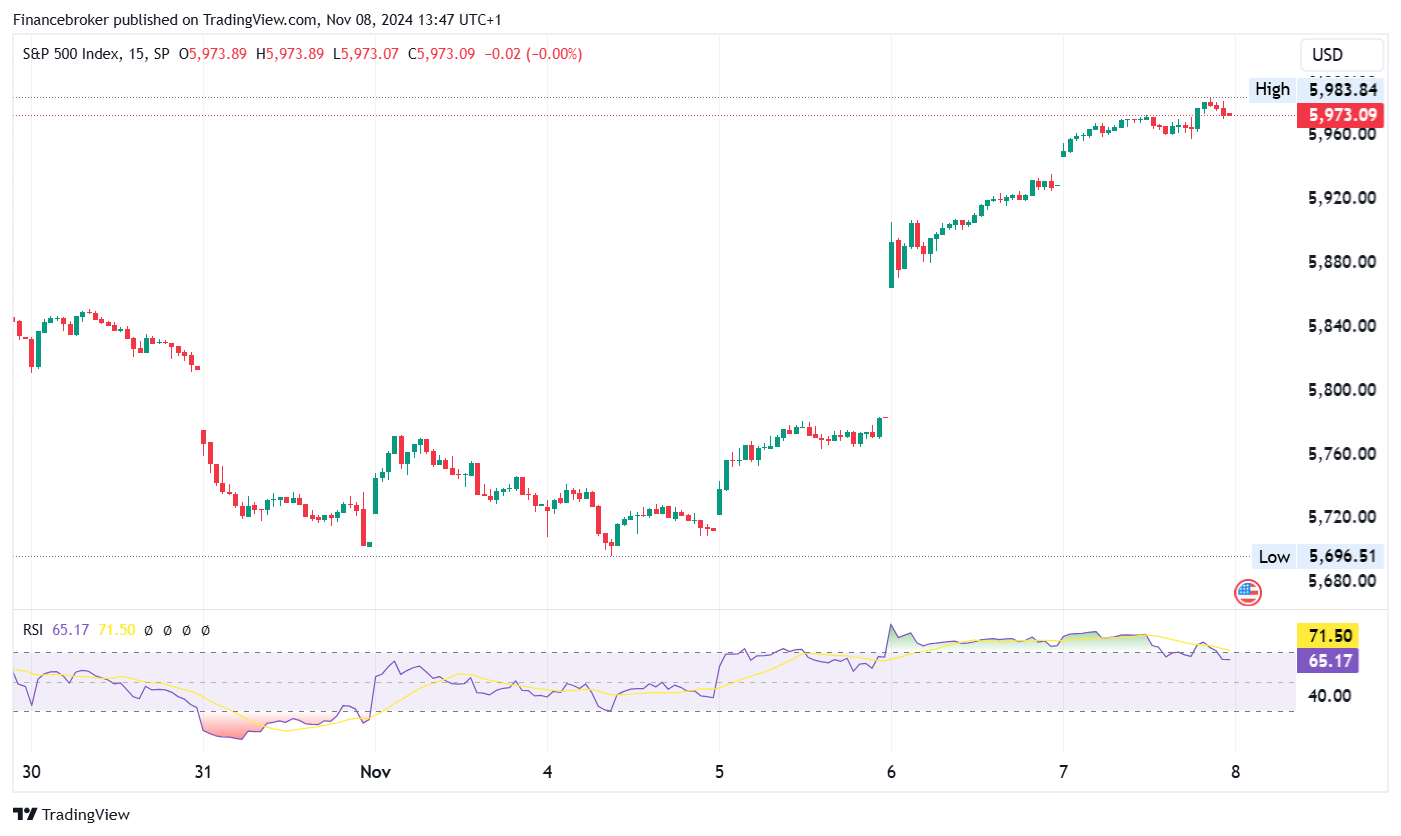
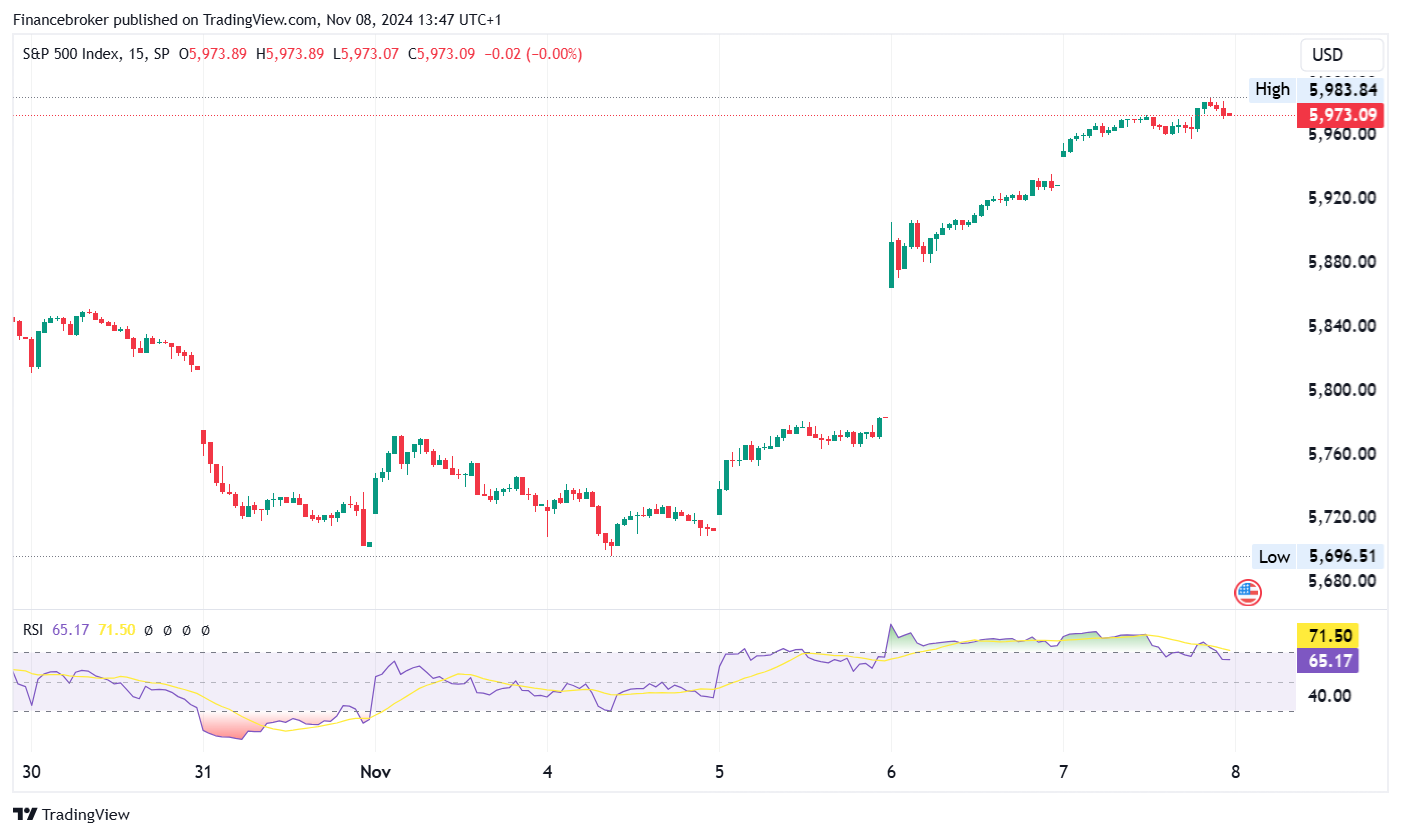
SP/USD 15-Minute Chart (Source: TradingView)
The chart displays a 15-minute snapshot of the S&P 500 Index (SPX) in the previous days. Nevertheless, the index, which plummeted in the period of October 30 to the start of November, witnessed a major upturn around November 5. The new increase brought about a sharp upward dynamic by the consecutive green candlesticks which represented buying pressure that made the price climb to a recent high point of 5,983.84.
The Relative Strength Index (RSI) appears at the lower end of the chart and actively demonstrates the upward trend. Its values have grown significantly, reaching 70, indicating that the index is overbought. This overbought measurement is usually a red flag, showing the possibility that the index will pull back or consolidate near-term as sellers who brought the stock to this high level may exit the market.
Traders should observe if the index will be centred at the current level or if it will fall back to $5,900 or lower support zones.
All in all, although the trend is still going up, it is important to be cautious because of the overbought RSI and the recent high test.
Take your profits on your current positions or put close-stop losses on your profits, as the fallback maybe soon. People entering should be patient and wait for favourable support at the 5,900 level to have a better entry point.
The post S&P 500 Hits Record as Fed Cuts Rates appeared first on FinanceBrokerage.
